# Entendendo Root Locus
A idéia aqui é usar comandos simples do Matlab para entender como o *root locus* é formado e qual a relaçao entre os pólos de malha-fechada e respostas temporais de um processo.
Se sugere fortemente uma eventual revistida do material [Respostas Transitórias de Sistemas Lineares]()
% G = tf(num,den)
num=1;
den=[1 10 0];
G = tf(num,den)
G =
1
----------
s^2 + 10 s
Continuous-time transfer function.
zpk(G)
ans =
1
--------
s (s+10)
Continuous-time zero/pole/gain model.
root(den)
{�Undefined function 'root' for input
arguments of type 'double'.}�
roots(den)
ans =
0
-10
pole(G)
ans =
0
-10
% ftmf=feedback(K*G, H, -1)
ftmf=feedback(G, 1)
ftmf =
1
--------------
s^2 + 10 s + 1
Continuous-time transfer function.
pole(ftmf)
ans =
-9.899
-0.10102
ftmf=feedback(0.01*G, 1);
pole(ftmf)
ans =
-9.999
-0.0010001
ftmf=feedback(5*G, 1);
pole(ftmf)
ans =
-9.4721
-0.52786
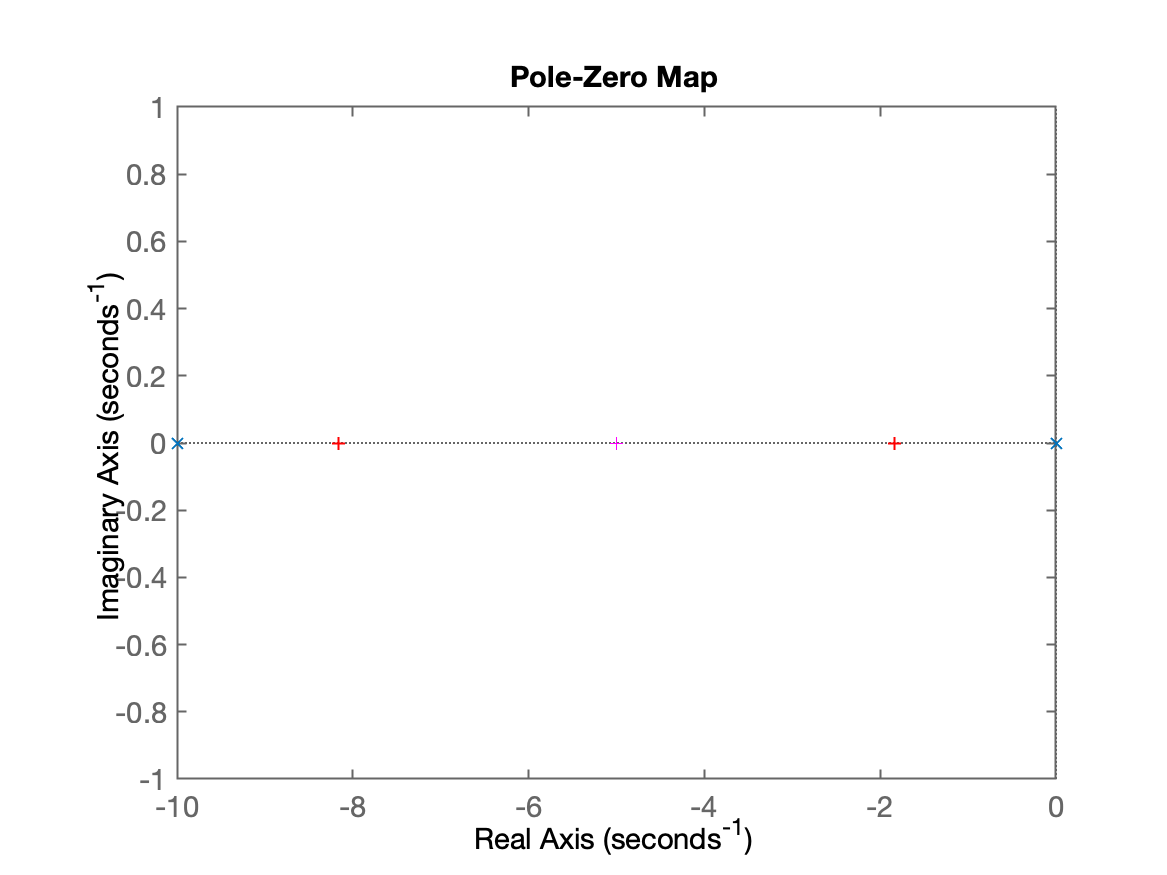
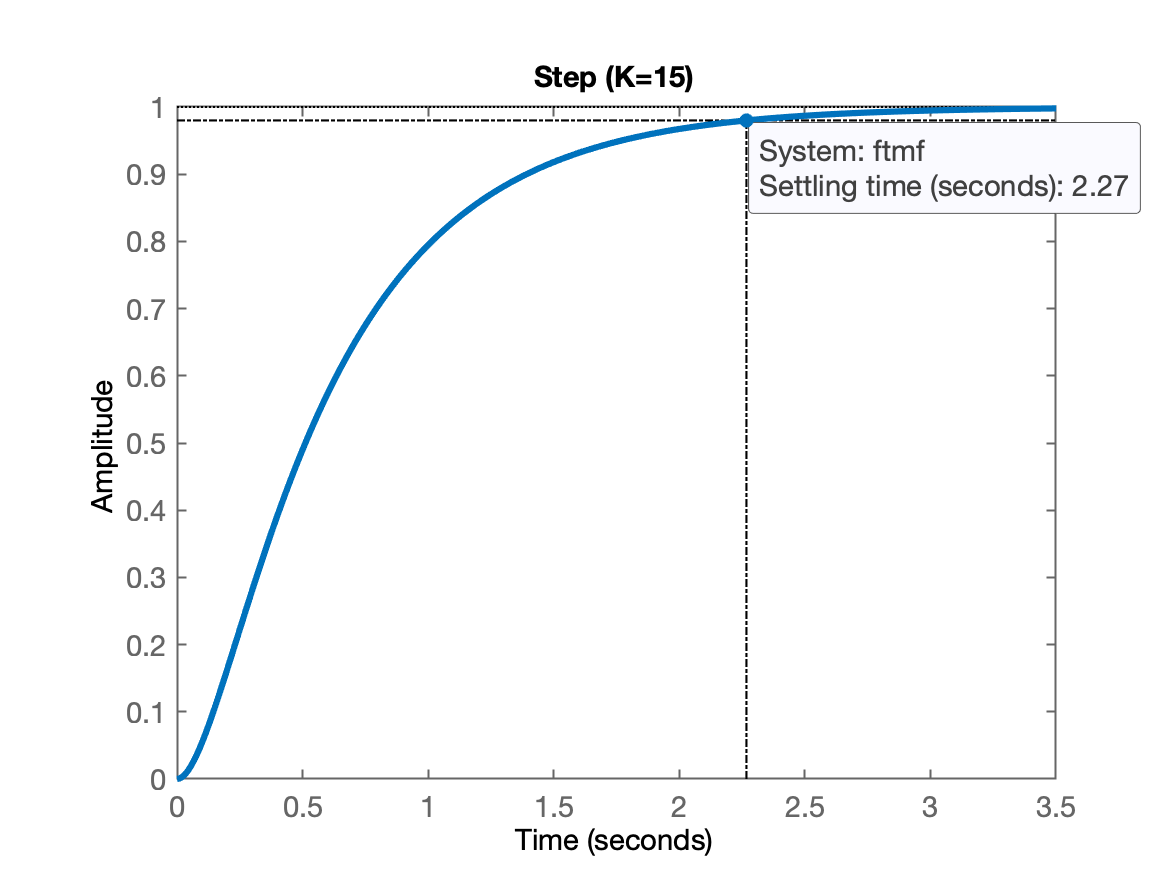
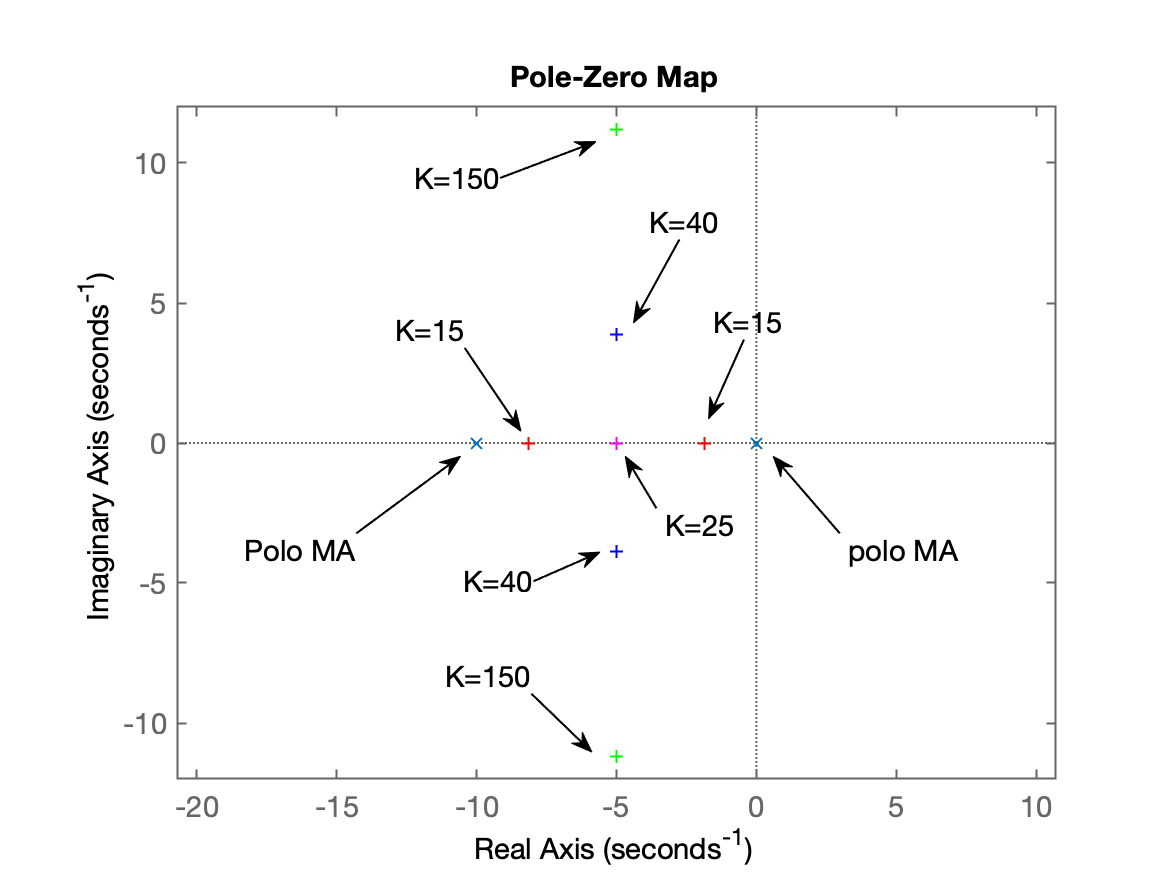
ftmf=feedback(15*G, 1);
pole(ftmf)
ans =
-8.1623
-1.8377
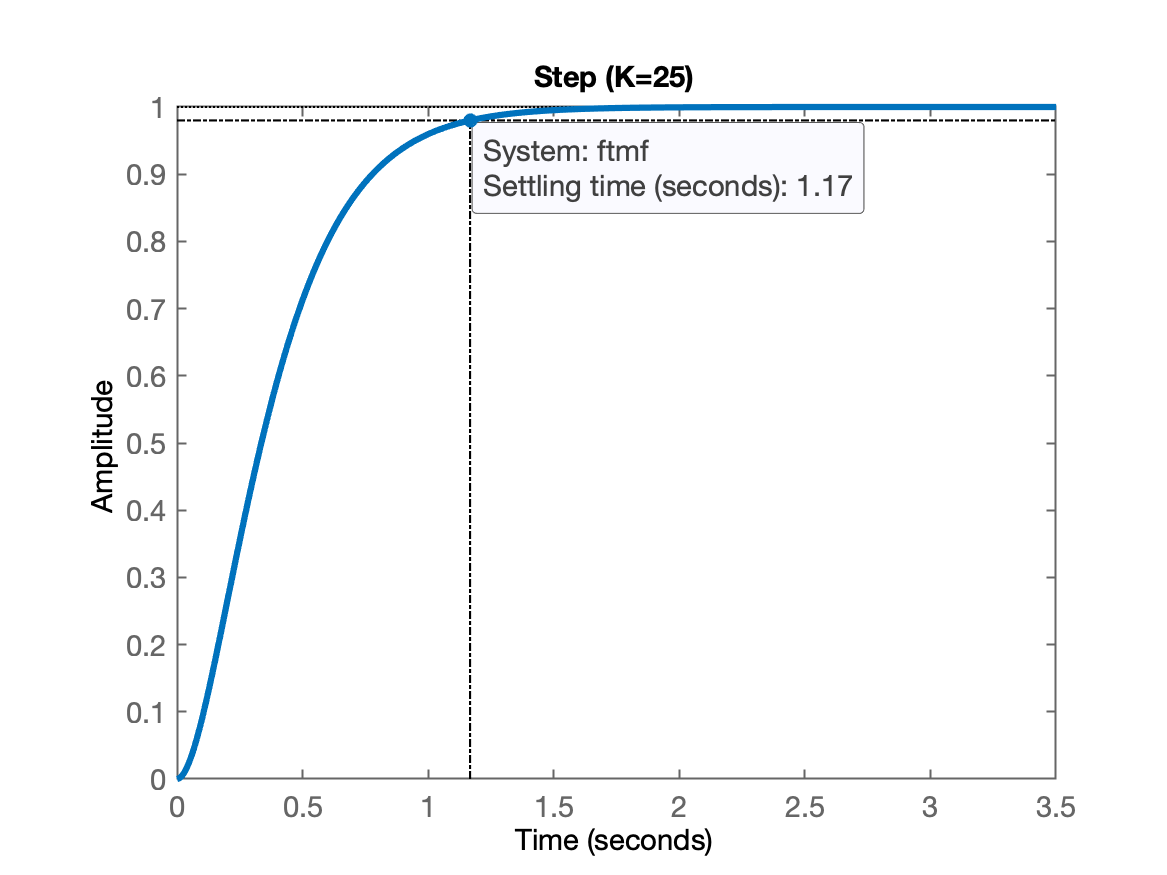
ftmf=feedback(25*G, 1);
pole(ftmf)
ans =
-5
-5
ftmf=feedback(15*G, 1);
pzmç
pzmç
�
{�Error: Invalid text character. Check for
unsupported symbol, invisible character, or
pasting of non-ASCII characters.
}�
pzmap(G)
hold on % "segura as pontas"
pzmap(pole(ftmf))
{�Error using pzmap (line 66)
Wrong number of input arguments.}�
polesMF=pole(ftmf)
polesMF =
-8.1623
-1.8377
real(polesMF)
ans =
-8.1623
-1.8377
imag(polesMF)
ans =
0
0
plot(real(polesMF),imag(polesMF),'r+')
figure; step(ftmf)
ftmf=feedback(25*G, 1);
polesMF=pole(ftmf)
polesMF =
-5
-5
figure(1)
plot(real(polesMF),imag(polesMF),'m+')
title('Step (K=15)')
figure; step(ftmf)
title('Step (K=25)')
save aula_26041024
diary off
% 
title('Step (K=15)')
title('Step (K=25)')
% 
% 
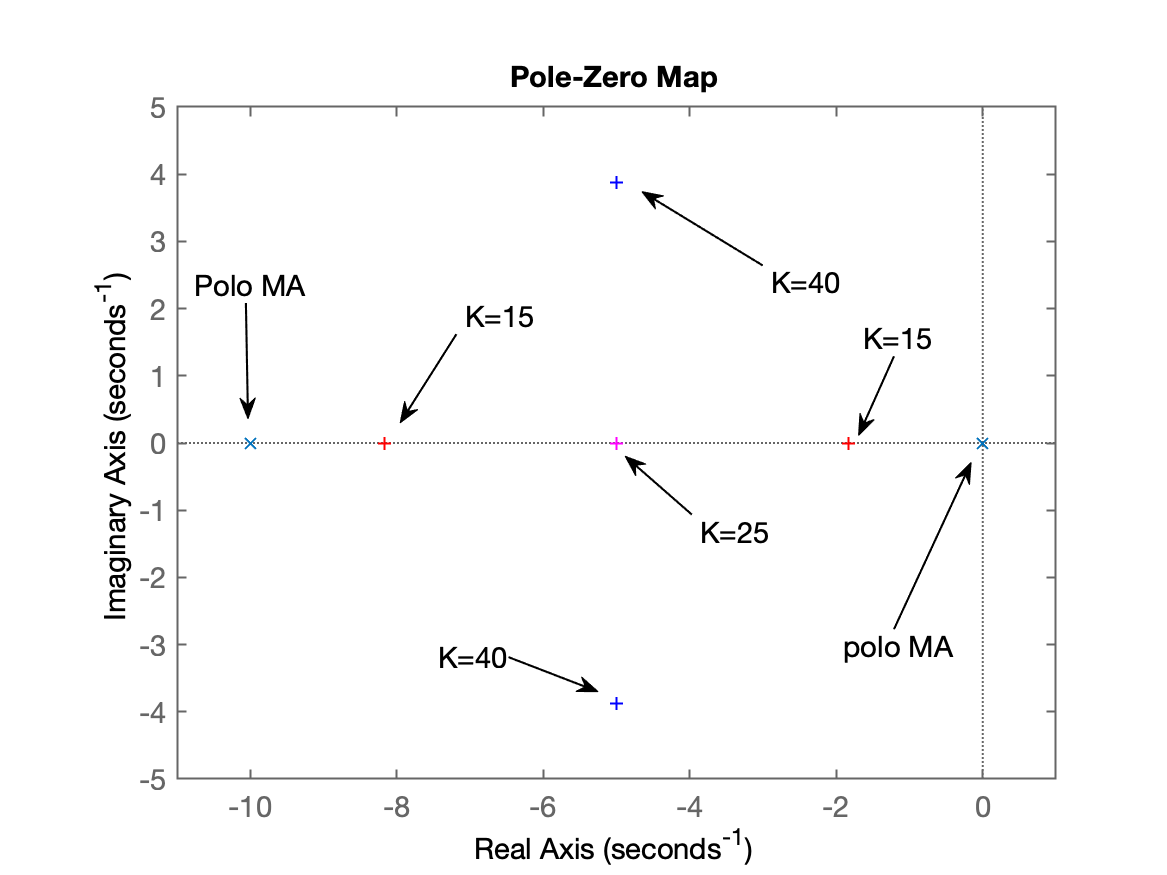
ftmf=feedback(40*G, 1);
polesMF=pole(ftmf)
polesMF =
-5 + 3.873i
-5 - 3.873i
figure(1);
hold on
plot(real(polesMF),imag(polesMF),'b+')
% axis([xmin xman ymin ymax])
axis([-11 1 -5 5])
% 
40
ans =
40
figure; step(ftmf)
title('Step (K=40)')
figure; step(ftmf)
title('Step (K=40)')
[�Warning: Error occurred while executing the
listener callback for event WindowMouseMotion
defined for class matlab.ui.Figure:
Invalid or deleted object.
Error in
matlab.graphics.shape.internal.PointDataTipController.dragOrientation]�
[�Warning: Error occurred while executing the
listener callback for event WindowMouseMotion
defined for class matlab.ui.Figure:
Invalid or deleted object.
Error in
matlab.graphics.shape.internal.PointDataTipController.dragOrientation]�
[�Warning: Error occurred while executing the
listener callback for event WindowMouseMotion
defined for class matlab.ui.Figure:
Invalid or deleted object.
Error in
matlab.graphics.shape.internal.PointDataTipController.dragOrientation]�
[�Warning: Error occurred while executing the
listener callback for event WindowMouseMotion
defined for class matlab.ui.Figure:
Invalid or deleted object.
Error in
matlab.graphics.shape.internal.PointDataTipController.dragOrientation]�
[�Warning: Error occurred while executing the
listener callback for event WindowMouseMotion
defined for class matlab.ui.Figure:
Invalid or deleted object.
Error in
matlab.graphics.shape.internal.PointDataTipController.dragOrientation]�
[�Warning: Error occurred while executing the
listener callback for event WindowMouseMotion
defined for class matlab.ui.Figure:
Invalid or deleted object.
Error in
matlab.graphics.shape.internal.PointDataTipController.dragOrientation]�
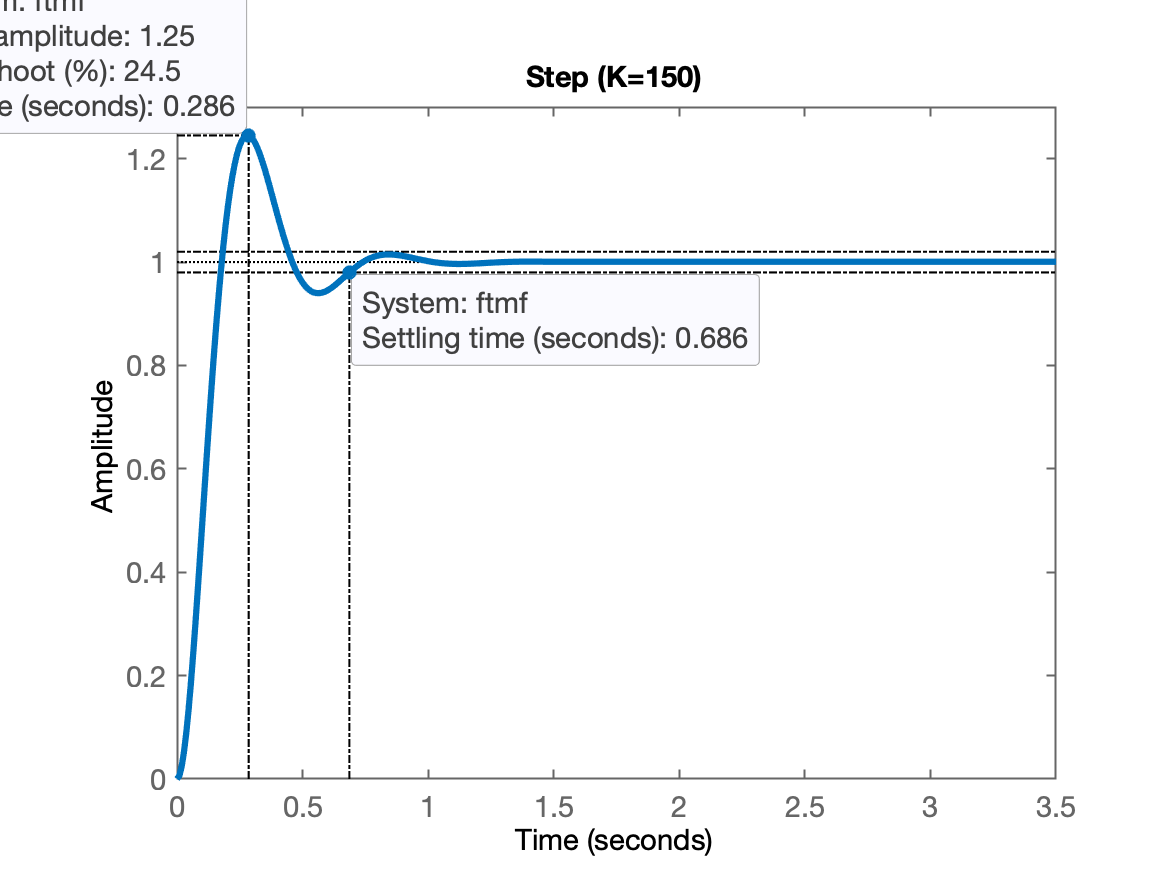
ftmf=feedback(150*G, 1);
polesMF=pole(ftmf)
polesMF =
-5 + 11.18i
-5 - 11.18i
figure(1)
plot(real(polesMF),imag(polesMF),'g+')
axis([-11 1 -12 12])
axis equal
% 
figure;step(ftmf)
title('Step (K=150)')
% 
save aula_26041024
diary off